|
| <-- Back to Previous Page | TOC | Next Section --> |
Chapter 3: The Frequency DomainSection 3.5: Problems with the FFT/IFFT
|
||
|
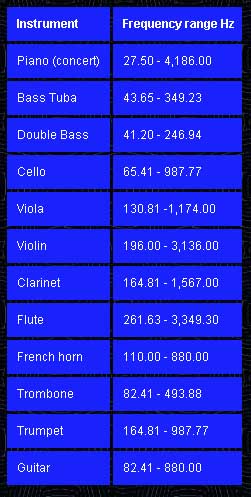
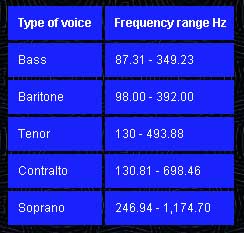
Figure 3.31 There is a lot of "wasted" space in an FFT analysis—most of the frequencies that are of concern to us tend to be below 5 kHz. Shown are the approximate ranges of some musical instruments and the human voice. It’s also a big, big problem that the FFT divides the frequency range into linear segments (each frequency bin is the same "width") while, as we well know, our perception of frequency is logarithmic. The FFT often sounds like the perfect tool for exploring the frequency domain and timbre, right? Well, it does work very well for many things, but it’s not without its problems. One of the main drawbacks is that the frequency bins are linear. For example, if we have a bin width of 43 Hz (which will be a result of dividing Nyquist frequency by the FFT frame size), then we have bins from 0 Hz to 43 Hz, 43 Hz to 86 Hz, 86 Hz to 129 Hz, and so on. The problem with this, as we learned earlier, is that the human ear responds to frequency logarithmically, not linearly. At low frequencies, 43 Hz is quite a wide interval—the jump from 43 Hz to 86 Hz is a whole octave! But at higher frequencies, 43 Hz is a tiny interval (perceptually)—less than a minor second. So the FFT has very fine high-frequency pitch resolution, but very poor low-frequency resolution. The effect of the FFT’s linearity is that, for us, much of the FFT data is "wasted" on recording high-frequency information very accurately, at the expense of the low-frequency information that is generally more useful in a musical context. Wavelets, which we’ll look at in Section 3.6, are one approach to solving this problem. |
||
|
|
||
|
|
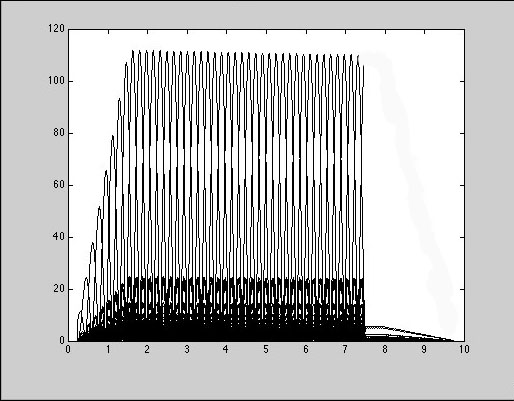
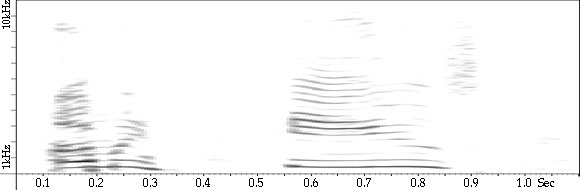
Soundfile 3.10 is an example of a sine wave swept from 50 Hz to 10 kHz, processed through an FFT. Figure 3.32 illustrates the sine wave sweep in an FFT analysis. The lobes that you see are the result of the energy of the sine wave "centering" in the successive FFT bands and then fading slightly as the width of the band forces the FFT into less accurate representations of the moving frequency (until it centers in the next band). In other words, one of the hardest things for an FFT to represent is a simply moving sine wave! |
|
|
|
||
|
Figure 3.32 Sweeping a sine wave through an FFT. Frequency and Time Resolution Trade-OffA related drawback of the FFT is the trade-off that must be made between frequency and time resolution. The more accurately we want to measure the frequency content of a signal, the more samples we have to analyze in each frame of the FFT. Yet there is a cost to expanding the frame size—the larger the frame, the less we know about the temporal events that take place within that frame. In other words, more samples require more time; but the longer the time, the less the sound over that interval looks like a sine wave, or something periodic—so the less well it is represented by the FFT. We simply can’t have it both ways! |
||
|
|
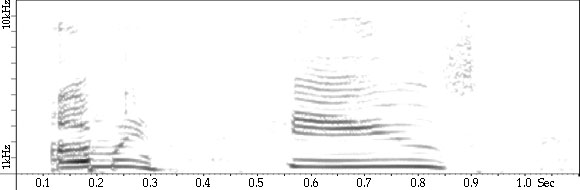
Figure 3.33 Selecting an FFT size involves making trade-offs in terms of time and frequency accuracy. Basically it boils down to this: The more accurate the analysis is in one domain, the less accurate it will be in the other. This figure illustrates what happens when we choose different frame sizes. |
|
|
|
||
|
|
A fairly normal-sounding beat soundfile. |
|
|
|
||
|
|
In this example the beat soundfile has been processed to provide accurate frequency resolution but inaccurate time resolution, or rhythmic smearing. |
|
|
|
||
|
|
In this example the beat soundfile has been processed to provide accurate rhythmic resolution but inaccurate frequency resolution, or spectral smearing. |
|
|
|
||
Time SmearingWe mentioned that 1,024 samples (1k) is a pretty common frame size for an audio FFT. At a sample rate of 44.1 kHz, 1,024 samples is about 0.022 second of sound. What that means is that all the sonic events that take place within that 0.022 second will be lumped together and analyzed as one event. Because of the nature of the FFT, this "event" is actually treated as if it were an infinitely repeating periodic waveform. The amplitudes of the frequency components of all the sonic events in that time frame will be averaged, and these averages will end up in the frequency bins. This is known as time smearing. Now let’s say that we need more than the 43 Hz frequency resolution that a 1k FFT gives us. To get better frequency resolution, we need to use a bigger frame size. But a bigger frame size means that even more samples will be lumped together, giving us even worse time resolution. At a frame size of 2k we get a frequency resolution of about 21.5 Hz, but our time resolution goes down to about 0.05 (1/20) of a second. And, believe it or not, a great deal can happen in 1/20 of a second! Good Time ResolutionConversely, if we need good time resolution (say we’re analyzing some percussive sounds and we want to know exactly when they happen), we need to shrink the frame size. The ideal frame size for the time domain would of course be one sample—that way we would know at exactly which sample something happened. Unfortunately, with only one sample to analyze, we would get no useful frequency information out of the FFT at all. A more reasonable frame size and one that is considered small for audio, such as 256 samples (a 0.006-second chunk of time), gives us 128 analysis bands, for a bin width of about 172 Hz. While a 0.006-second time resolution is reasonable, 172 Hz is a pretty dreadful frequency resolution. That would put several bottom octaves of the piano into one averaged bin. A CompromiseSo what’s the answer to this time/frequency dilemma? There really isn’t one. If we use the FFT to do our analysis, we’re stuck with the fact that higher resolution in one domain results in lower resolution in the other. The trick is to find a useful balance, based on the types of sounds we are analyzing. No single frame size will work well for all sounds. |
||
| <-- Back to Previous Page | Next Section --> |
©Burk/Polansky/Repetto/Roberts/Rockmore. All rights reserved.