|
| <-- Back to Previous Page | TOC | |
Chapter 5: The Transformation of Sound by ComputerSection 5.7: Graphical Manipulation of Sound
|
||
We’ve seen how it’s possible to take sounds and turn them into pictures by displaying their spectral data in sonograms, waterfall plots, and so on. But how about going the other way? What about creating a picture of a sound, and then synthesizing it into an actual sound? Or how about starting with a picture of something else—Dan Rockmore’s dog Digger, for instance? What would he sound like? Or how about editing a sound as an image—what if you could draw a box around some region of a sound and simply drag it to some other place, or erase part of it, or apply a "blur" filter to it? Graphical manipulation of sound is still a relatively underdeveloped
and emerging field, and the last few years have seen some exciting developments
in the theory and tools needed to do such work. One of the interesting
issues about it is that the graphical manipulations may not have any obvious
relationship to the sonic effects. This could be looked upon as either
a drawback or an advantage. Although graphical techniques are used for
both the synthesis and transformation of sounds, much of the current work
in this area seems geared more toward sonic manipulation than synthesis. |
||
Pre–Digital Era Graphic ManipulationComposers have always been interested in exploring the relationships between color, shape, and sound. In fact, people in general are fascinated with this. Throughout history, certain people have been synaesthetic—they see sound or hear color. Color organs, sound pictures, even just visual descriptions of sound have been an important part of the way people try to understand sound and music, and most importantly their own experience of it. Timbre is often called "sound color," even though sound color should more appropriately be analogized to frequency/pitch. Computer musicians have often been interested in working with sounds from a purely graphical perspective—a "let’s see what would happen if" kind of approach. Creating and editing sounds graphically is not a new idea, although it’s only recently that we’ve had tools flexible enough to do it well. Even before digital computers, there were a number of graphics-to-sound systems in use. In fact, some of the earliest film sound technology was optical—a waveform was printed, or even drawn by hand (as in the wonderfully imaginative work of Canadian filmmaker Norman McLaren), on a thin stripe of film running along the socket holes. A light shining through the waveform allowed electronic circuitry to sense and play back the sound. Canadian inventor and composer Hugh LeCaine took a different approach. In the late 1950s, he created an instrument called the Spectrogram, consisting of a bank of 108 analog sine wave oscillators controlled by curves drawn on long rolls of paper. The paper was fed into the instrument, which sensed the curves and used them to determine the frequency and volume of each oscillator. Sound familiar? It should—LeCaine’s Spectrogram was essentially an analog additive synthesis instrument!
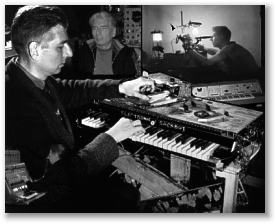
Figure 5.18 Canadian composer and instrument builder, and one of the great pioneers of electronic and computer music, Hugh LeCaine. LeCaine was especially interested in physical and visual descriptions of electronic music. UPIC SystemOne of the first digital graphics-to-sound schemes, Iannis Xenakis’s UPIC (Unité Polyagogique Informatique du CEMAMu) system, was similar to LeCaine’s invention in that it allowed composers to draw lines and curves that represent control information for a bank of oscillators (in this case, digital oscillators). In addition, it allowed the user to perform graphical manipulations (cut and paste, copy, rearrange, etc.) on what had been drawn. Another benefit of the digital nature of the UPIC system was that any waveform (including sampled ones) could be used in the synthesis of the sound. By the early 1990s, UPIC was able to do all of its synthesis and processing live, enabling it to be used as a real-time performance instrument. Newer versions of the UPIC system are still being developed and are currently in use at CEMAMu (Centre des Etudes Mathématiques Automatiques Musicales) in Paris, an important center for research in computer music. AudioSculpt and SoundHackMore recently, a number of FFT/IFFT-based graphical sound manipulation techniques have been developed. One of the most advanced is AudioSculpt from IRCAM in France. AudioSculpt allows you to operate on spectral data as you would an image in a painting program—you can paint, erase, filter, move around, and perform any number of other operations on the sonograms that AudioSculpt presents.
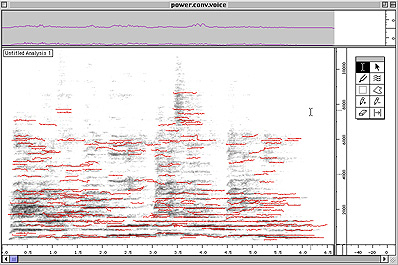
Figure 5.19 FFT data displayed as a sonogram in the computer music program AudioSculpt. Partials detected in the sound are indicated by the red lines. On the right are a number of tools for selecting and manipulating the sound/image data. Another similar, and in some ways more sophisticated, approach is Tom
Erbe’s QT-coder, a part of his SoundHack program. The QT-coder allows
you to save the results of an FFT of a sound as a color image that contains
all of the data (magnitude and phase) associated with the sound you’ve
analyzed (as opposed to AudioSculpt, which only presents you with the
magnitude information). It saves the images as successive frames of a
QuickTime movie, which can then be opened by most image/video editing
software. The result is that you can process and manipulate your sound
using not only specialized audio tools, but also a large number of programs
meant primarily for traditional image/video processing. The movie can
then be brought back into SoundHack for resynthesis. It is also possible
to go the other way, that is, to use SoundHack to synthesize an actual
movie into sound, manipulate that sound, and then transform it back into
a movie. As you may imagine, using this technique can cause some pretty
strange effects! |
||
|
|
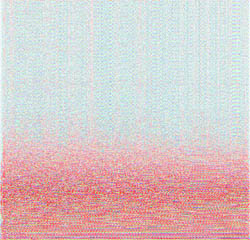
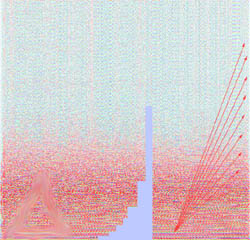
Figure 5.20 An
original image created by the QT-coder in SoundHack (left), and the image
after alterations (right). Listen to the original sound (Soundfile 5.26)
and examine the original image. Now examine the altered image. Can you
guess what the alterations (Soundfile 5.27) will sound like? |
|
|
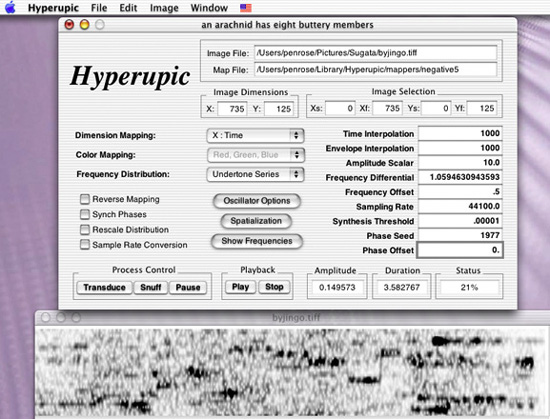
|
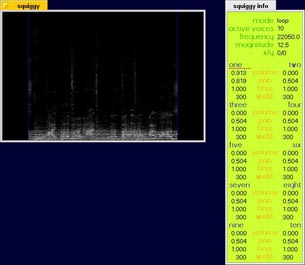
Figure 5.21 Chris Penrose’s Hyperupic. This computer software allows for a wide variety of ways to transform images into sound. See Soundfile 5.28 for Penrose’s Hyperupic composition. squiggysquiggy, a project developed by one of the authors (repetto), combines some of the benefits of both the UPIC system and the FFT-based techniques. It allows for the real-time creation, manipulation, and playback of sonograms. squiggy can record, store, and play back a number of sonograms at once, each of which can be drawn on, filtered, shifted, flipped, erased, looped, combined in various ways, scrubbed, mixed, panned, and so on—all live. The goal of squiggy is to create an instrument for live performance that combines some of the functionality of a traditional time-domain sampler with the intuitiveness and timbral flexibility of frequency-domain processing.
Figure 5.22 Screenshot from
squiggy, a real-time spectral manipulation tool by douglas repetto. |
| <-- Back to Previous Page | |
©Burk/Polansky/Repetto/Roberts/Rockmore. All rights reserved.