|
Sonification
There are a great many functions that occur in nature, and one thing that composers have often experimented with is the sonification of those functions. (Sonification is the process of turning non-aural information into sound.) What do the stars in the sky sound like? How about the skyline of New York City? Or the fluctuations of the stock market? What would it mean to "listen" to such things? How can you take a natural process, a set of data, any sort of non-sound signal, and convert it perceptually to sound? For example, is it possible that by listening to a fast playback of the digits of Engineers and academics who study this idea often call it auditory display, and besides being artistically interesting, it can have important functional applications. For example, imagine when the air in your car’s tires started to get low: your car starts to hum, and that hum gets higher and higher as the tires get flatter and flatter (sort of "reverse" sonification). The academic discipline of auditory display tends to divide this field into three categories (thanks to composer/researcher Ed Childs for the following and for some good ideas in this section):
The question of exactly how to sonify a function is often referred to as the mapping problem, since the first thing that needs to be done is to figure out how to map, or relate, the original information to sonic parameters such as pitch, amplitude, and timbre.
Let’s take a simple example: what if we want to "listen" to the digits of the number Pretty boring. Well, maybe the number It would be difficult, if not impossible, for most people to know what they were listening to without being told. But artistically, this may not even matter! One of the primary issues that composers working with sonification need to address is: does it matter if the listeners "know" what they are listening to, and if so, how? How we map data can often be more significant than the data itself. Is there something inherently "musical" about these digits, and if so, are we just not ready to hear it? What do you think? The motivations behind sonification are similar to those of graphical representations of data—the idea is that by mapping information from one domain onto another, we will perceive the data in a new way and hopefully gain some insight into what the data means. Instead of visualizing something, we auralize it. It’s interesting that in computer music, we often go the other way as well—for instance, a sonogram is a graphical representation of a set of aural data that gives us insights into the sound that we might otherwise not have had. Sonification is not only a musically interesting technique—it’s an idea being studied and used in many areas, particularly as an alternative to visually presented data. For example, airline pilots, who already have enough things to look at, might use sonification to "listen" to the status of certain key gauges in the cockpit. Or a scientist studying population growth might listen to population data from a number of countries, to try to hear any similarities or trends that aren’t obvious from the raw or graphed data. Can you think of other areas where sonification might be useful?
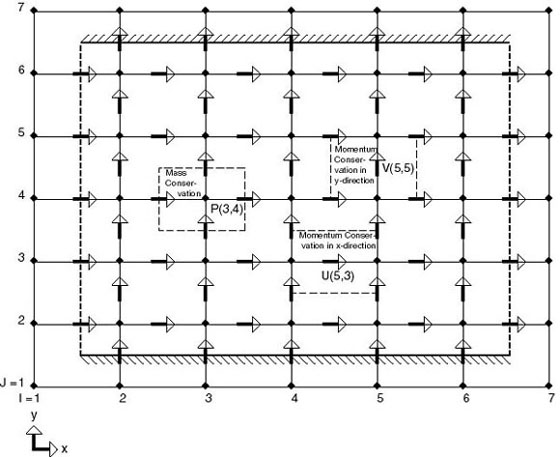
Figure 2 Ed Childs' fluid dynamics sonification (original data) Composer/researcher Ed Childs has been doing some interesting work in the sonification of complex mathematical problems involving fluid flow, an area which has long been of interest visually. Figure 2 is a typical graphical representation of a discretization of space, used by scientists to solve the complex sets of equations that describe the movement of fluid in some prescribed location (in this case, a horizontal duct into which flow enters across the dashed line at the left and leaves across the dashed line at the right). The horizontal and vertical arrows and the dots, respectively, are the storage locations of the x and y component velocities and the pressures. By mapping each discrete velocity and pressure to sound as the solver runs, Childs has been trying to present an aural description of the fluid flow solver. There are two sound files below. The first sound file is a direct sonification. The second sound file is a piece built up from ten sonifications with different parameters.
©Burk/Polansky/Repetto/Roberts/Rockmore. All rights reserved. |
||||||||||||||||||||||